


")


")


by Mike Franchetti, SDI, Customer Insight Analyst
These days, data analysis and the use of statistics extend to a number of job roles. A desirable skill is the ability to ‘tell a story’ using data instead of merely presenting values. In order for these stories to be best sellers, there are some underlying principles of statistics that should not be ignored. Here are five common mistakes – and how to avoid them.
1. Assuming data is ‘normal’
Many statistical tests make the assumption that data follows a ‘Normal Distribution’. Normal data, when plotted as a frequency distribution (histogram), will create an approximately symmetrical ‘bell curve’ with the majority of observations near the midpoint. This assumption can be tested and if data fails to conform many analyses are rendered untrue. A common cropper to non-normal data is the mean average. Non-normal data will often be skewed and have a mean value that doesn’t reflect reality. An example of skewed data comes from the amount of time patients wait prior to seeing a doctor. Typical data will be positively skewed, with a majority of patients seen within 15 minutes but a ‘long tail’ of unlucky patients waiting up to an hour. In this example, the mean would be unfairly large.
2. Not seeing the big picture
Numbers don’t lie but considered in isolation they can be highly misleading. Take the example of a winter clothing company examining sales data at the end of winter. They notice sales have been alarmingly low, despite increases in advertising spend and market share. They struggle to make sense of the data and end up concluding their latest campaign to be wholly unsuccessful. What the numbers missed, however, was the fact there had just been the warmest winter on record and a subsequent drop in demand. When presented with a dataset it is crucial to have an understanding of wider influences that can derive from sources existing outside the data.
3. Undersized and underpowered
Whether you’re looking at all households in the UK or everybody who watches EastEnders, it’s extremely unlikely your dataset will include an entire population. Instead, you’ll be working with a sample. Whilst common sense will usually dictate what a good sample size should be, there are certain statistical pitfalls to watch out for. Small samples will lead to untrustworthy results with each observation having high influence and conclusions based on random ‘noise’. Other issues associated with small samples include large margins of error and underpowered statistics. Simply put, you won’t have any confidence in your results.
4. Sample bias
Sticking with samples, a more common mistake is bias. Imagine a study estimating the percentage of people in the UK to have read George Orwell’s ‘1984’. If you surveyed a sample of 1000 English Literature students you would find your result to be artificially inflated. The study would be biased heavily towards avid readers and a poor reflection of the UK population. Simple Random Sampling would be an improved selection method in this case, with Stratified Sampling an even better approach. In order to gain meaningful results, a sample must be representative of the population of interest.
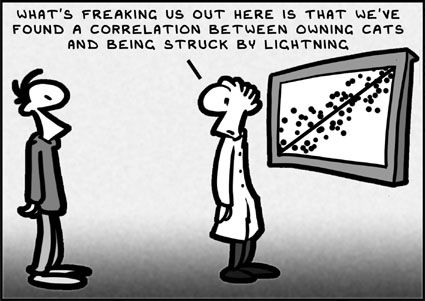
5. Correlation is not causation
Identifying correlations between two variables and assuming a relationship can lead to the most bizarre of conclusions. Tests may detect a positive correlation between two factors but wrong conclusions can often follow. There are hundreds of examples on the internet of the correlation/causation fallacy but my favourite involves a drunken individual. Every Friday a man would go to the pub, drink ten pints of beer, walk home and fall asleep with his shoes on. The next day, without fail, he would wake up with a headache. He recorded his sleep patterns over time before reaching the most ridiculous conclusion, telling his friends “every time I fall asleep with my shoes on I wake up with a headache, the two must be related”. He was, of course, ignoring his drinking habits. Whilst the two appeared to be related, no relationship would exist without the presence of a third variable – his drinking. The most accurate way to test for causality is by performing a controlled experiment. Conditions should be set so that there is just one influence on the experimental group that a control group does not possess.
Whether you’re dealing with a retrospective dataset or involved in the designing of the study, it’s important to keep these five points in mind. Flawed data analysis can lead to peculiar conclusions and ultimately costly mistakes.