Diving into Data, Concept 8, and Deriving Value
By Scarlett Bayes, Senior Research Analyst, SDI
The Service Desk Institute’s certification programme gives us an insight into a wide variety of organisations and how different service desks perform against the Global Best Practice Standard for Service Desk and its 9 ‘concepts’:
- Leadership
- Policy & Strategy
- People Management
- Resources
- Processes & Procedures
- Managing Employee Satisfaction
- Managing the Customer Experience
- Management Information & Results
- Corporate Social Responsibility
You can find out more information and download the Standard here.
According to the data, we can see that, on average, organisations in the public sector tend to be better at employee experience and corporate responsibility, though the two sectors are very close in most concepts.
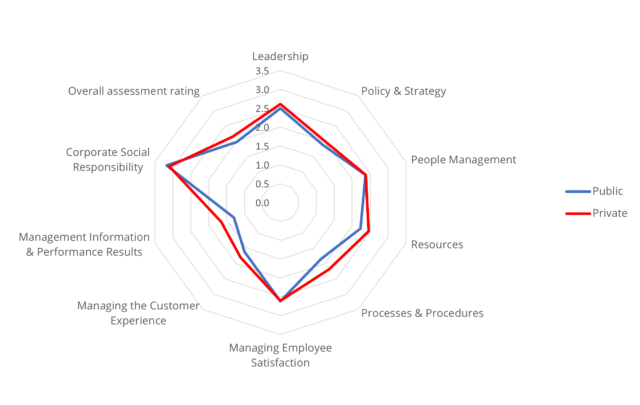
Concept 8 – Management Information & Performance Results – is consistently the concept where organisations perform the least well. Metrics are an incredibly useful tool on the service desk; they allow managers to monitor multiple areas of service, can allow them to highlight successes and areas for improvement, and keep an eye on how well service improvement attempts are working. However, if not used efficiently, metrics can become a waste of time and resources, and potentially cause more harm than good.
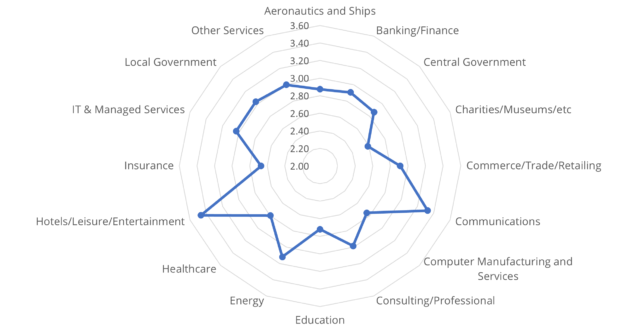
A breakdown of industries tells us that the Hotels/Leisure/Entertainment, Communications, Energy, and Local Government sectors typically perform the best in this concept, whereas Charities/Museums/etc perform the least well. Healthcare and Education sectors also have a lower average performance, which is important to note, as these industries tend to be public services.
Is Concept 8 difficult?
Firstly, Concept 8 has the most competencies; 44 to be specific. The next largest concept is Concept 5, which has 23 competencies, though the rest have around 10 each. Furthermore, Concept 8 includes individual competencies for around 40 different performance metrics, thereby requiring organisations to have a significant amount of performance data, preferably with trends and analysis, in order to score high. For example, in order to score a 4-star score in competency 8.4, Number of Incidents, you need to have:
- Forecasting targets for the volume of incidents received for all communication channels
- The actual volume be routinely captured and compared for at least one year
- Results trending towards the targets
- Trend data being used to predict future resource requirements
- Trends being analysed, commentated and articulated to key stakeholders
On the surface, this is a lot of work to undertake, especially when applied to around 40 performance metrics. However, there are many tools available which support reporting and can automate the process.
With this in mind, if you are thinking of going through the certification process, try not to be put off by the prospect of Concept 8. The aim of SDI’s certification programme is to help IT services, provide guidance, and highlight areas for improvement.
You have the data, now what?
Aside from measuring it, what are you really doing with your performance data? There is more that you can do with this data than simply measuring different metrics to “tick a box”, to measure against targets, or to produce a report for management.
As highlighted in the Standard, trend analysis of performance data over several months can allow you to make predictions regarding future resource requirements, allowing the service desk to become more efficient. Performance data can also be used to make other decisions, perhaps with regards to implementing new technologies, frameworks, or ways of working.
Over time, this data can also be used to evaluate how well changes to IT services have worked. For example, if you implemented automated workflows to enhance your self-service portal as a way to deflect tickets from the service desk, this can be monitored using metric data pertaining to this change. If the change is not what you would expect, this can be a signal that you need to alter your approach in order to ensure success moving forward.
Customer experience data is also useful to monitor overtime. As well as how well your service desk is performing according to more quantitative data, understanding the experience of your service for your customers and how that has evolved over time according to any changes that have been made to IT services, or how any disruptions to service affected the customer experience. This can then be relayed to key stakeholders as an indicator of value. For example, should a major incident occur, IT services may be able to adequately communicate what’s going on and manage customer interactions in a way which limit the negative impact.
So while arguably, metrics are more commonly used to monitor performance against service level targets, but it can also be an effective way of measuring changes in service quality. Finding a balance that suits your service desk is key to succeeding with metrics, and showing your value to the business.
